
5 Climate Change (ESRS E1)
ESRS reference: ESRS E1 Climate Change / Sub-topics: Climate change mitigation; Energy
ESRS cross-references: ESRS E2 Pollution; ESRS E3 Water; ESRS E4 Biodiversity and Ecosystems; ESRS E5 Resource Use and Circular Economy
HorizonNOW 2030: Sustainable procurement, sustainable operation; targets 2 & 3
5.1 Relevance of Topic
Section titled “5.1 Relevance of Topic”Climate change is material for Siegwerk because its business model and value chain are structurally linked to greenhouse gas (GHG) emissions.
Siegwerk formulates, produces and delivers printing inks and coatings for packaging applications. Production requires thermal energy, electricity, solvents and a mix of petrochemical and bio-based raw materials. These processes are integral to our operations and, with today’s technology and available alternatives, cannot be fully decoupled from GHG emissions. In our double materiality assessment, this was confirmed as a material negative actual impact of our own operations on climate stability.
At the same time, our DMA identified material positive actual impacts from on-site renewable energy. At several sites, Siegwerk generates and uses renewable electricity from solar power, reducing 2 emissions and supporting our decarbonization pathway. Any remaining non-renewable electricity is covered through the purchase of renewable electricity, increasing the positive impact.
However, the larger share of our footprint sits upstream. Around 90% of Siegwerk’s GHG emissions relate to purchased goods and services (Scope 3 – Category 1), reflecting energy-intensive extraction and production of raw materials such as chemicals and pigments. This upstream energy-related negative impact was also assessed as material.
Downstream climate-related impacts from distribution, product use and end-of-life were assessed in the DMA and scored below the materiality cut-off (overall impact score 2.4). Climate change remains material through own operations and the upstream value chain; accordingly, our climate targets and dedicated governance focus on Scope 1 and 2 and upstream Scope 3. Downstream Scope 3 categories are monitored in the inventory for completeness and may be revisited if customer or regulatory expectations change the assessment outcome.
Climate action is therefore central to HorizonNOW, covering sustainable operations (Scope 1 and 2) and sustainable procurement (Scope 3). Our near-term and net-zero targets have been validated by the Science Based Targets initiative (SBTi) and are aligned with the goals of the Paris Agreement. The following sections set out how we measure, govern and implement this material topic.
5.2 Metrics and Targets
Section titled “5.2 Metrics and Targets”This report references two strategic cycles with closely related climate metrics but different targets: HorizonNOW 2025 for performance in the current reporting period (2025), and HorizonNOW 2030 for outlook and for parts of our general management approach. Details on the transition between the two cycles are provided in Chapter 3.3. Siegwerk measures its climate change impact through key metrics linked to Group targets. Targets have been updated based on learnings from the 2020–2025 strategy cycle (HorizonNOW 2025) for the strategy in place as of 2026 (HorizonNOW 2030). The climate-related Group targets for both strategy cycles are summarized below:
Strategy cycle | Metric | Target | Target year | Baseline year | Commentary |
|---|---|---|---|---|---|
HorizonNOW 2025 | Scope 1 & 2 CO2e emissions | Carbon neutral Scope 1 and 2 globally:
| 2025 | 2020 | Reduction first approach. Remaining emissions to be covered through certificates (Scope 2) and offsets (Scope 1) |
Scope 3 CO2e emissions | Reduce by 25% | 2030 | 2020 | ||
HorizonNOW 2030 | Scope 1 & 2 CO2e emissions | Reduce Scope 1 and 2 emissions by 60% (absolute) | 2030 | 2020 | |
Share and quality of renewable electricity | Maintain 100% renewable electricity for own operations | 2030 | n.a. | Increase quality of renewable electricity by moving away from certificates towards sources providing additionality to the renewable electricity |
Table 8: Climate change targets for HorizonNOW 2025 and 2030
The global targets represent an aggregated view of regional and site-specific targets. This approach allows us to address the specific challenges and opportunities of each site while driving an ambitious group-wide ambition.
Siegwerk’s climate targets have been independently validated by the Science Based Targets initiative (SBTi), confirming that our ambition is aligned with climate science and the goals of the Paris Agreement. Refer to Chapter 12.4.4 for further details on our SBTi Commitment.
Table 9 shows the development of Siegwerk’s GHG emissions since 2020. 2020 is the baseline year for all climate targets. There has been a significant downward trend of 70% since 2020 for Scope 1 and 2 (see Figure 16). The decline reflects energy efficiency measures, fuel and process changes, the phase-out of purchased steam, other absolute reduction projects and the purchase of renewable electricity certificates (RECs).
Within Scope 1, natural gas remains the largest single source. Fuel-related emissions rose temporarily in 2022 and have since declined sharply. This raise was due to a switch from gas-based to oil-based heating at the beginning of the Russian attack on Ukraine. Emissions from VOC incineration, which were largely stable through 2024, fell substantially in 2025 mainly due to increasing calculation and maturity in measurement. Within Scope 2 before market instruments, grid electricity dominates. Purchased steam, which contributed 673 tons CO₂e in the 2020 baseline, was phased out by 2025.
Siegwerk has been sourcing 100% renewable electricity which explains the high renewable energy sources as shown in Table 10. Non-renewable sources mainly come from Scope 1 energy sources. Of the energy produced by Siegwerk (Table 11), all is renewable, as the values reflect the solar capacities installed at our sites. There has been a dip in electricity production in 2024 due to a fire at our Indian site, which affected solar panels installed. During the writing of the report, however, the amount of solar electricity produced is already showing meaningful increase.
For Scope 3 there has been a steady decrease of emissions between 2020 and 2024 (see Figure 17). This changed in 2025, mainly due to a shift of raw materials purchased for new product developments entering or scaling in the market – often for new circular economy solutions. When matched against the production volumes, however, there remains to be a relative reduction from 2020 to 2025.
For all scopes, further commentary on the development of key metrics, especially in relation to targets, is provided in Chapter 5.5.
Siegwerk does not fall into a high climate impact sector.
in t CO2e | 2020 | 2021 | 2022 | 2023 | 2024 | 2025 | Actual % change (2020 to 2025) | Targeted % change (2020 to 2025) |
|---|---|---|---|---|---|---|---|---|
Scope 1 GHG emissions | ||||||||
Gross scope 1 GHG emissions (tCO2eq) | 16.798 | 17.698 | 18.514 | 15.837 | 14.336 | 12.348 | -26,5% | -100 % /carbon neutral (Scope 1 and 2 combined) |
Percentage of scope 1 GHG emissions from the EU Emissions Trading System (EU ETS) (%) | 0,0% | 0,0% | 0,0% | 0,0% | 0,0% | 0,0% | n.a. | n.a. |
Scope 2 GHG emissions | ||||||||
Gross location-based scope 2 GHG emissions (tCO2eq) | 28.291 | 29.397 | 26.939 | 26.633 | 27.345 | 27.876 | -1,5% | n.a. |
Gross market-based scope 2 GHG emissions (tCO2eq) | 24.542 | 20.520 | 13.668 | 0 | 0 | 0 | -100% | -100 % /carbon neutral (Scope 1 and 2 combined) |
Significant scope 3 GHG emissions | ||||||||
Total gross indirect (scope 3) GHG emissions (tCO2eq) | 937.600 | no data collected | no data collected | 819.072 | 858.544 | 978.209 | 4,3% | |
1. Purchased goods and services | 865.335 | no data collected | no data collected | 762.566 | 806.441 | 885.601 | 2,3% | 30% by 2030 (no 2025 specific target) |
[sub-category: Cloud computing and data centre services] | n.a. | n.a. | n.a. | n.a. | n.a. | n.a. | n.a. | n.a. |
2. Capital goods | 23.373 | no data collected | no data collected | 11.607 | 11.607 | 20.525 | -12,2% | n.a. |
3. Fuel- and energy-related activities | 6.388 | no data collected | no data collected | 6.313 | 6.313 | 6.070 | -5,0% | n.a. |
4. Upstream transportation and distribution | 14.014 | no data collected | no data collected | 16.520 | 16.520 | 17.896 | 27,7% | n.a. |
5. Waste generated in operations | 1.714 | no data collected | no data collected | 788 | 788 | 4.263 | 148,7% | n.a. |
6. Business traveling | 6.135 | no data collected | no data collected | 4.403 | 0 | 2.220 | -63,8% | n.a. |
7. Employee commuting | 5.461 | no data collected | no data collected | 5.111 | 5.111 | 5.111 | -6,4% | n.a. |
8. Upstream leased assets | n.a. | n.a. | n.a. | n.a. | n.a. | n.a. | n.a. | n.a. |
9. Downstream transportation | 15.180 | no data collected | no data collected | 11.764 | 11.764 | 36.523 | 140,6% | n.a. |
10. Processing of sold products | n.a. | n.a. | n.a. | n.a. | n.a. | n.a. | n.a. | n.a. |
11. Use of sold products | n.a. | n.a. | n.a. | n.a. | n.a. | n.a. | n.a. | n.a. |
12. End-of-life treatment of sold products | n.a. | n.a. | n.a. | n.a. | n.a. | n.a. | n.a. | n.a. |
13. Downstream leased assets | n.a. | n.a. | n.a. | n.a. | n.a. | n.a. | n.a. | n.a. |
14. Franchises | n.a. | n.a. | n.a. | n.a. | n.a. | n.a. | n.a. | n.a. |
15. Investments | n.a. | n.a. | n.a. | n.a. | n.a. | n.a. | n.a. | n.a. |
Direct biogenic scope 1 emissions | 176 | 141 | 211 | 191 | 116 | 60 | n.a. | n.a. |
Table 9: Gross Scope 1, 2 and 3 GHG emissions (ESRS E1-8) 1
In Mwh | 2020 | 2021 | 2022 | 2023 | 2024 | 2025 |
|---|---|---|---|---|---|---|
Total energy consumption from fossil sources | 95.001 | 108.196 | 99.308 | 54.441 | 49.459 | 52.950 |
Total energy consumption from nuclear sources | 6.790 | - | - | - | - | - |
Total energy consumption from renewable sources | 20.365 | 21.904 | 29.720 | 64.939 | 68.138 | 65.779 |
Total | 122.156 | 130.100 | 129.028 | 119.381 | 117.596 | 118.728 |
Table 10: Total energy consumption and mix (market-based) (ESRS E1-7, para. 26)
In Mwh | 2020 | 2021 | 2022 | 2023 | 2024 | 2025 |
|---|---|---|---|---|---|---|
Renewable | - | - | 1188 | 1229 | 1851 | 958 |
Non-renewable | - | - | - | - | - | - |
Total energy produced | - | - | 1188 | 1229 | 1851 | 958 |
Table 11: Energy consumption and mix (ESRS E1-7, para. 28)
5.3 Policies & Governance
Section titled “5.3 Policies & Governance”5.3.1 Overall
Section titled “5.3.1 Overall”We apply the Greenhouse Gas Protocol Corporate Standard and ISO 14064 for corporate carbon accounting, and ISO 14067 for product carbon footprint methodology. Selected sites operate certified energy management systems in accordance with ISO 50001. See Chapter 12.4.5 for an overview of ISO certificates.
Climate change is integrated into the Sustainability Policy and our Business Partner Code of Conduct (for the upstream value chain). Further, supporting documents include the GHG Report (available upon request) and the White Paper on Partial Product Carbon Footprints (relevant for Scope 3). Internally available documents that solidify our governance approach include operational engineering guidelines and guidance on reporting data.
See the following sub-chapter for governance information for Scope 1, 2 and 3 respectively.
5.3.2 Scope 1 and 2
Section titled “5.3.2 Scope 1 and 2”Absolute reduction projects
Section titled “Absolute reduction projects”Absolute reduction projects such as energy-efficiency measures are implemented locally through local Supply Chain Management (SCM). Global Engineering supports these efforts, for example by sharing best practice and providing operational guidelines. Global Sustainability maintains a Group-wide overview of the absolute reduction pipeline and monitor progress. Sites are also urged to develop carbon reduction roadmaps, which are then integrated into overall site investment plans. Where needed, external expertise (through consultancies or energy providers) and Global Engineering support the sites in developing these roadmaps.
Renewable electricity
Section titled “Renewable electricity”Investment in own solar capacities is managed in the same way as absolute reduction projects, as described above. An important topic of global HSE oversight for solar is fire safety. Specific guidelines provide orientation to the local SCM teams. However, the purchase of renewable electricity certificates is coordinated through Global Sustainability where local markets allow, with the aim of ensuring high certificate quality and oversight of coverage and efficiency.
Data management
Section titled “Data management”Global Sustainability has overarching responsibility for all consolidated carbon reporting and for ensuring adherence to applicable standards, providing data management systems (including reporting tools (together with Finance) and reporting schedules), providing emissions and other conversion factors. For Scope 1 and 2 the sites carry the responsibility to input the required site-specific data on time, complete and accurate. Global Sustainability checks data as an additional level of quality control. For Scope 3 the data generation is shared across Global Product Safety and Responsibility (for category 1) and Global Sustainability (for the other categories).
Financial integration
Section titled “Financial integration”Siegwerk has incorporated carbon and broader sustainability performance into financial decision-making and financing arrangements:
Internal carbon price for capital expenditures
Under HorizonNOW 2025 a carbon shadow price was integrated into the Capital Expense Request (CER) evaluation process, whereby projects receive a carbon price premium or burden depending on their emission impact. Clearance of the CERs by Global Sustainability was part of the approval process. This strengthened sustainability-related oversight and control of projects that affect the company’s emission performance. Further, it provided an awareness creation of the relevance of emissions as part of investment discussion throughout a larger part of the organization.
The price was defined and adjusted based on risk considerations and carbon pricing markets including regulatory and market mechanisms such as Emissions Trading System (ETS) (which Siegwerk is not subject to directly) prices and renewable energy pricing.
ESG-linked loan:
Siegwerk has an ESG-linked loan. Defined ESG targets linked to HorizonNOW 2025 influence the interest rate for the relevant loan scheme. The KPIs cover carbon reduction, occupational health and safety (Total Incident Rate), and supplier commitment to the principles of the UN Global Compact. Performance against these KPIs is reviewed annually by an independent third party.
Green Fund
During the strategy cycle of HorizonNOW 2025 most carbon reduction projects in the pipeline with commercially attractive payback times have been implemented. Hence, for the HorizonNOW 2030 strategy cycle additional mechanisms have been established to support the implementation of projects with less attractive pay-back time, namely the Green Fund. The Green Fund focuses on physical carbon-reduction investments. Governance follows a top-down “push” model: Global Sustainability acts as Project Management Office (PMO), consolidates project proposals from entities and Regional Sustainability Managers into a global project list, and prepares a shortlist of high-impact projects for decision. Final project selection and communication are decided by the Group Executive Committee (GEC), with Regional Presidents and execution-critical functions such as SCM involved in the process. Selection is based on pre-defined criteria (including alignment with goals, risk consideration and data completeness) and a weighted scoring model covering carbon cost efficiency, feasibility and co-benefits. Approved projects are integrated into budgeting and monitored for impact by Global Sustainability together with regional stakeholders.
5.3.3 Scope 3
Section titled “5.3.3 Scope 3”Upstream Scope 3 reduction is mainly managed through the SustainUP program (see Chapter 12.1). Downstream emissions were not identified as material in the DMA. Accordingly, no separate dedicated governance structure is in place for downstream climate impacts beyond our general product and logistics processes. There is, however, a cross-functional Scope 3 working group (comprising of Global Sustainability, Purchasing, Product Safety and Technology) which discusses overarching topics and reduction levers, as outlined below.
5.4 Actions
Section titled “5.4 Actions”5.4.1 General approach
Section titled “5.4.1 General approach”Scope 1 and 2
Section titled “Scope 1 and 2”Siegwerk’s Scope 1 and 2 actions follow two complementary pillars: absolute energy and emission reduction projects, and the continuous securing of 100% renewable electricity. Together, these levers underpin the HorizonNOW 2030 pathway toward a 60% absolute reduction in Scope 1 and 2 emissions by 2030 versus the 2020 baseline. The concept of a hierarchy of emission reduction levers (i.e. absolute reduction always first) is a continuation of the climate action strategy of HorizonNOW 2025.
Absolute reduction
Section titled “Absolute reduction”Energy and emission reduction projects are managed through a combination of site-specific plans, clear governance and dedicated financing. Sites are responsible for defining their reduction targets and achieving those through the implementation of projects. Projects usually fall into one of three categories:
- efficiency: reduction of energy use, e.g. by replacing old equipment;
- lower carbon energies: switching from high-carbon energies to lower carbon alternatives, e.g. the electrification of heating; and
- installation of renewable electricity on site, solar in particular (also contributing to our target of maintaining a 100% renewable electricity).
Renewable electricity
Section titled “Renewable electricity”Maintaining 100% renewable electricity is the foundation of Siegwerk’s carbon reduction roadmap. It delivers immediate Scope 2 impact and enables the carbon reduction effects of further Scope 1 reductions through electrification.
Our sourcing approach aims at increasing the quality of its renewable electricity sources, whereas quality is defined as creating additionality to the overall renewable electricity capacities. As such, Siegwerk seeks to increase the share of high-quality sourcing options as displayed in Figure 10.
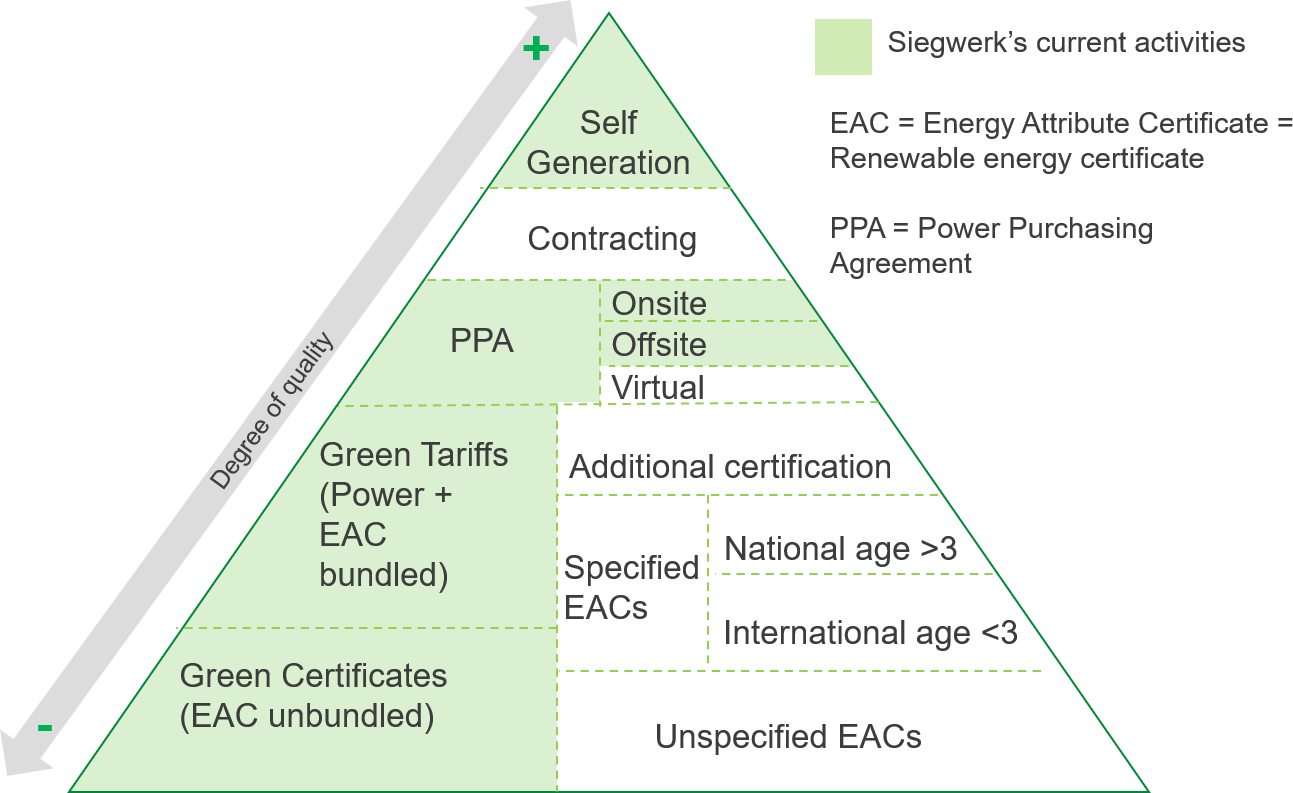
Figure 10: Renewable electricity sourcing approach
At the end of the strategic cycle of HorizonNOW 2025 the following renewable electricity models have been established:
- installation of solar panels on site in India (as on-site Power Purchasing Agreement (PPA)), Thailand, Argentina and Mexico;
- investments in off-site PPA in India;
- switch to suppliers with higher renewable shares and/or Green Tariffs in Brazil and Spain; and
- EKOenergy certified renewable electricity certificates.
RE100 CRITERIA FOR RENEWABLE ELECTRICITY CERTIFICATES
RE100 (Climate Group / CDP) sets widely used technical criteria for credible corporate claims to use 100% renewable electricity. Energy attribute certificates (EACs) – such as Guarantees of Origin (GOs) in Europe, Renewable Energy Certificates (RECs) in North America, and International RECs (I-RECs) elsewhere – are the preferred way to document exclusive ownership of renewable electricity attributes.
Under the RE100 technical criteria, certificates should meet the following principles:
- exclusive claim: Attributes must be uniquely owned and retired/canceled so no other party can claim the same renewable electricity;
- market boundary: Certificates must come from the same electricity market in which the electricity is consumed (e.g. AIB/EECS markets in Europe under RE100’s updated definition);
- temporal matching: Generation vintage should reasonably match the consumption period (typically the same reporting year);
- additionality signal (from 1 January 2024): At least 85% of renewable electricity should come from generation assets commissioned or re-powered within the preceding 15 years; up to 15% may come from older assets; and
- eligible technologies: Wind, solar, and geothermal are generally eligible; hydropower and biomass require documented sustainability evidence.
EKOenergy: INCRREASING THE POSITIVE EFFECTS OF CLIMATE ACTION
EKOenergy ensures additional benefits such as:
- endorsements by environmental NGOs;
- recommendation by CDP and Greenhouse Gas Protocol Scope 2 Guidance;
- additional positive impact through the renewable energy projects;
- allocation of funding to low and middle income countries to fight energy poverty; and
- addressing several of the UN’s Sustainable Development Goals, as mentioned in a UN Department of Economic and Social Affairs publication.
For HorizonNOW 2030 we will be expanding this approach to investigate into larger PPAs and expand our own on-site solar capacities to reduce the reliance on unbundled EACs.
Figure 11 shows the carbon reduction development and future anticipated roadmap for Scopes 1 and 2. The reduction levers described above are depicted in the context of anticipated growth of emission through the growth of our business and the proportionate increase in energy needs. The carbon reduction roadmap also shows a contingency increase. We have added this based on our experience that project implementation can be delayed, emission factors can increase or business growth is faster than expected, especially in markets with relatively higher emissions per kg produced due to the available energy mix.
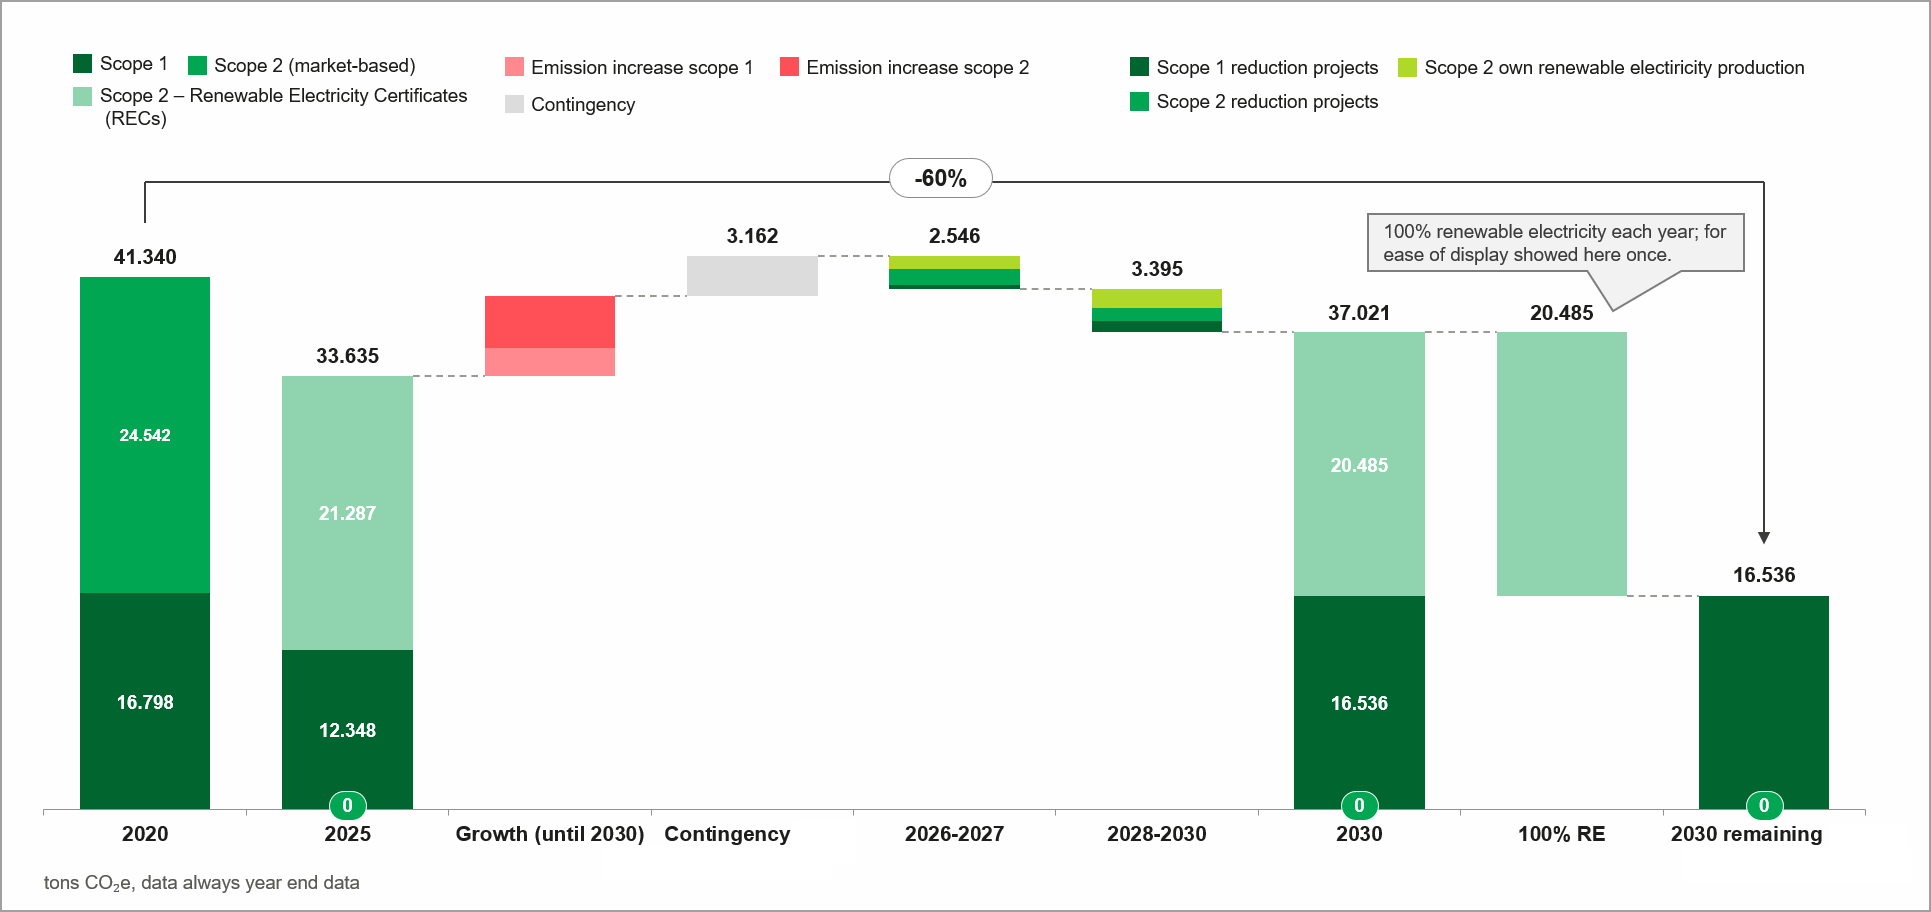
Figure 11: Scope 1 and 2 emission trajectory (2025 -2030)2
Siegwerk has a fairly large degree of control over the implementation of the actions described above. There are, however, limiting factors. These include emission factors in regulated energy markets. While there is a general trend toward more renewables, rising electricity demand - for example from data centers (United States) or growth in consumption per user in emerging economies - may not be matched by renewable capacity in time, which can affect grid emission factors and residual market-based Scope 2 outcomes.
Scope 3
Section titled “Scope 3”Upstream Scope 3 greenhouse gas (GHG) emissions are the dominant component of Siegwerk’s corporate carbon footprint. In our double materiality assessment, the most significant climate-related impact was confirmed as the negative, actual effect of upstream energy use and purchased goods and services on climate stability. Downstream Scope 3 emissions were not identified as material; accordingly, no separate dedicated governance structure has been established for downstream categories
Siegwerk’s Scope 3 reduction strategy follows a phased logic.
HorizonNOW 2025: Building a reliable data foundation and exploring options
Section titled “HorizonNOW 2025: Building a reliable data foundation and exploring options”During HorizonNOW 2025, the focus was on building a robust data system for our Scope 3 emissions. This included the mapping of all relevant Scope 3 emission categories to understand the emission drivers and thus areas of focus. Resulting in our Scope 3 baseline and an understanding that Scope 3 – Category 1 – Purchased Goods and Servies (and within that raw materials) will require the most attention. The foundational work also allows Siegwerk to produce partial Product Carbon Footprint (P-PCF) data for all products. These activities concluded in 2022 with the successful completion of the third party validation of Siegwerk’s P‑PCF approach by TÜV SÜD against ISO 14067:2019 and the verification of the Corporate Carbon Footprint in accordance with ISO 14064-3:2019.
Additionally, stakeholder engagement was sought to understand reduction levers and momentum. This included conversations with suppliers to understand the availability of primary data and reduction targets as well as with customers to understand their future needs and thus potential for demand trickling through the value chain. By having the Scope 3 data system in place, with the subsequent ability to produce validated P-PCF data for customers, engagement on customer side could be increased.
HorizonNOW 2030: Active approach
Section titled “HorizonNOW 2030: Active approach”Based on the insight gathered, HorizonNOW 2030 is now focusing on a structured approach to achieve the reduction targets as shown in Figure 12.
Baseline activities focus on supplier data, transparency and capability building. Subsequent phases integrate carbon into purchasing decisions and product development, complemented where appropriate by deeper supplier collaboration. Across all phases, grid greening — the progressive decarbonization of national electricity systems — is expected to deliver additional reductions in the carbon intensity of supplier production over time.
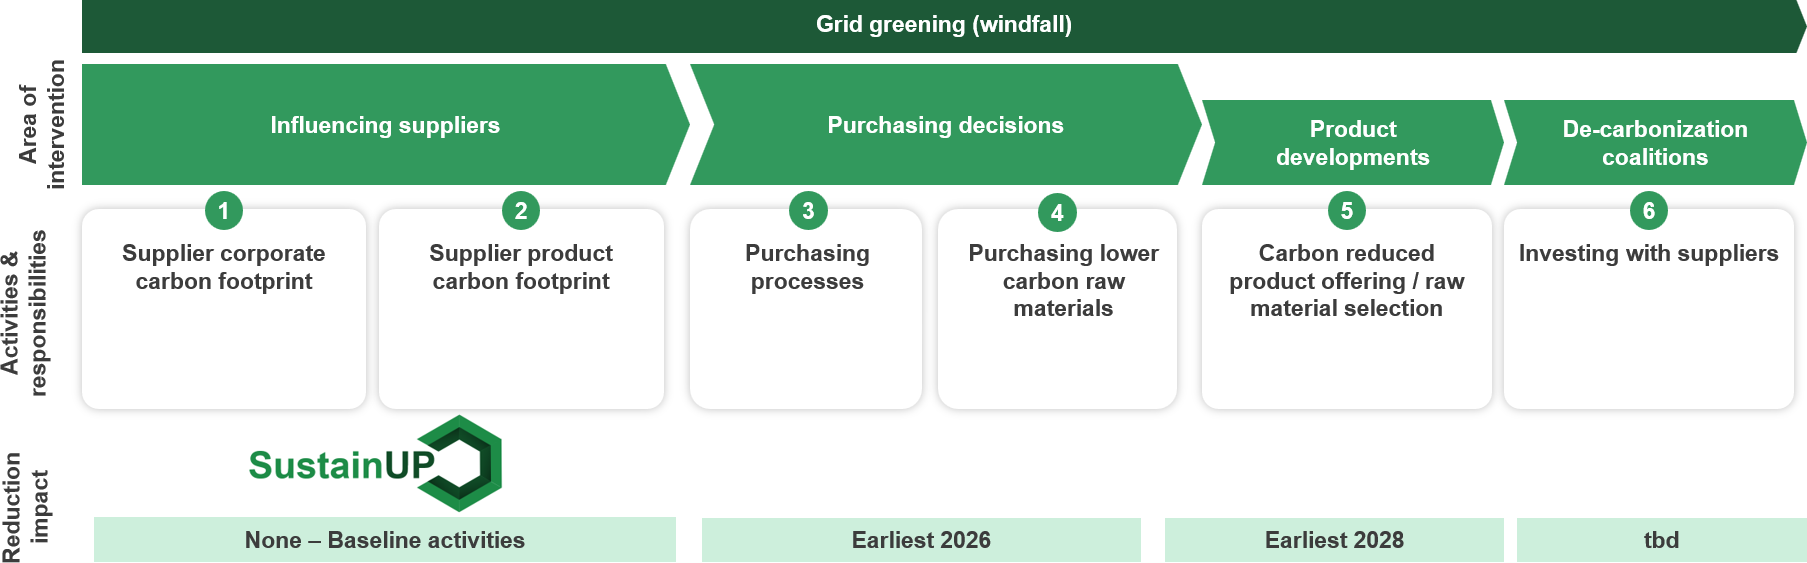
Figure 12: Scope 3 - 2030 - Decarbonization strategy
In more detail, the strategy comprises six decarbonization levers, grouped into four areas of intervention:
Grid greening (windfall)
Section titled “Grid greening (windfall)”As electricity grids decarbonize, the energy used by suppliers to manufacture raw materials is expected to carry a lower carbon intensity over time. This effect is reflected progressively in raw material carbon data and requires no dedicated Siegwerk activity. It is treated as a supporting, external reduction factor rather than a managed action lever.
Lever 1: Supplier corporate carbon footprint
Section titled “Lever 1: Supplier corporate carbon footprint”Many suppliers are at different levels of maturity in measuring and managing emissions. Siegwerk therefore requests that suppliers calculate their corporate carbon footprint (Scopes 1, 2 and, where feasible, 3), set corporate reduction targets and participate in enablement activities such as training. This lever does not deliver immediate absolute reductions but improves forecasting, prioritization and identification of high-impact collaboration partners.
Lever 2: Supplier product carbon footprint
Section titled “Lever 2: Supplier product carbon footprint”At present, only a small share of raw material carbon data is supplier-specific; the majority is based on secondary databases. Siegwerk is working to increase the availability of primary product carbon footprint (PCF) data by requesting, vetting and — where quality criteria are met — integrating supplier PCF data into enterprise systems. This improves the evidence base for lower-carbon purchasing decisions.
Lever 3: Purchasing processes
Section titled “Lever 3: Purchasing processes”Carbon metrics should be integrated into internal procurement decision-making. Examples include requiring justification where a lower-carbon supplier alternative exists for the same raw material but is not selected. This lever establishes the governance and process conditions needed for consistent low-carbon sourcing.
Lever 4: Purchasing lower-carbon raw materials
Section titled “Lever 4: Purchasing lower-carbon raw materials”Where supplier-specific data is available, Siegwerk can switch between suppliers of the same raw material with better carbon performance, subject to supply security and qualification requirements. In parallel, the company actively seeks lower-carbon raw material alternatives that meet existing product specifications. Customer demand and requalification needs can accelerate implementation.
Lever 5: Carbon-reduced product offering and product developments
Section titled “Lever 5: Carbon-reduced product offering and product developments”Business units and R&D are developing lower-carbon product series and supporting customers in selecting lower-carbon alternatives. In the future, guidelines may be established for technology to increasingly incorporate carbon considerations into raw material selection, ensuring that new formulations do not inadvertently increase embedded emissions.
Lever 6: Decarbonization coalitions
Section titled “Lever 6: Decarbonization coalitions”Where deeper collaboration is warranted, Siegwerk explores options to support suppliers in reducing their own emissions, for example through renewable electricity certificates, co-investment in energy efficiency or renewable generation (including power purchase agreements), or guarantees to help scale emerging low-carbon supply chains. The scale and timing of this lever depends on supplier maturity and project feasibility.
Activities are currently concentrated on levers 1, 2 and 4 (supplier corporate carbon footprint, supplier product carbon footprint, and purchasing lower-carbon raw materials). Baseline supplier engagement (levers 1 and 2) is underway and is not yet expected to deliver material absolute reductions. Purchasing process integration and lower-carbon sourcing (levers 3 and 4) are expected to contribute from 2026 at the earliest, subject to data availability and qualification requirements. Product-development levers are expected to scale from 2028 onward, depending on customer demand and technical alternatives. However, first product innovations in this area are being released in the market (e.g. UniNATURE and UniLEAF). Decarbonization coalitions remain under evaluation.
Figure 13 shows the carbon reduction development and future anticipated roadmap for Scope 3. The reduction levers described above are depicted in the context of anticipated growth of emission. Business growth fueled by selling additional volumes and thus raw materials needed has a direct impact on emissions growth – with compounding effect year over year. It should be noted that the forward-looking reduction potentials are estimates only, with a significant amount of uncertainty. Siegwerk’s ability to deliver Scope 3 reductions depends on factors largely outside direct operational control. These include supplier maturity in carbon accounting and target setting, willingness to share corporate and product carbon footprint data, the availability and quality of lower-carbon raw material alternatives, customer demand for requalification of formulations, and regulatory developments affecting energy and chemical supply chains. Grid greening can support reductions but cannot be managed directly. For these reasons, Scope 3 outcomes should be interpreted as directional and subject to periodic review as supplier data quality and market offerings improve.
Please refer to Chapter 5.5.2 for commentary on past reductions.
When combining our Scope 1, 2 and 3 emissions trajectory (see Figure 14) it remains clear how relevant the share of Scope 3 is in the context of impactful climate action.
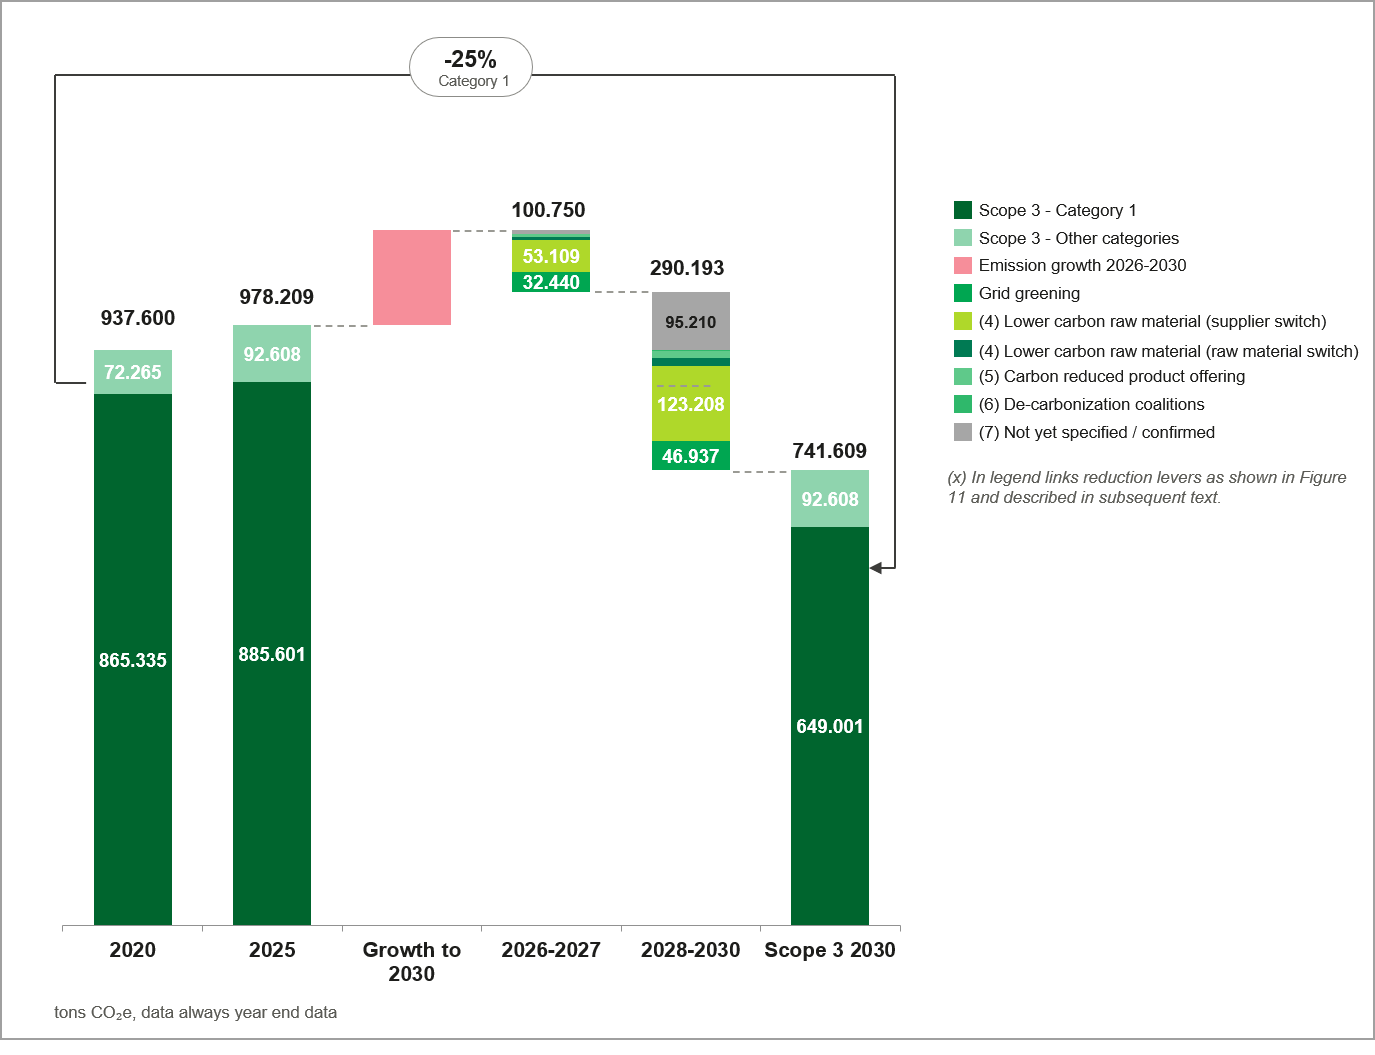
Figure 13: Scope 3 emissions trajectory (2025 -2030)
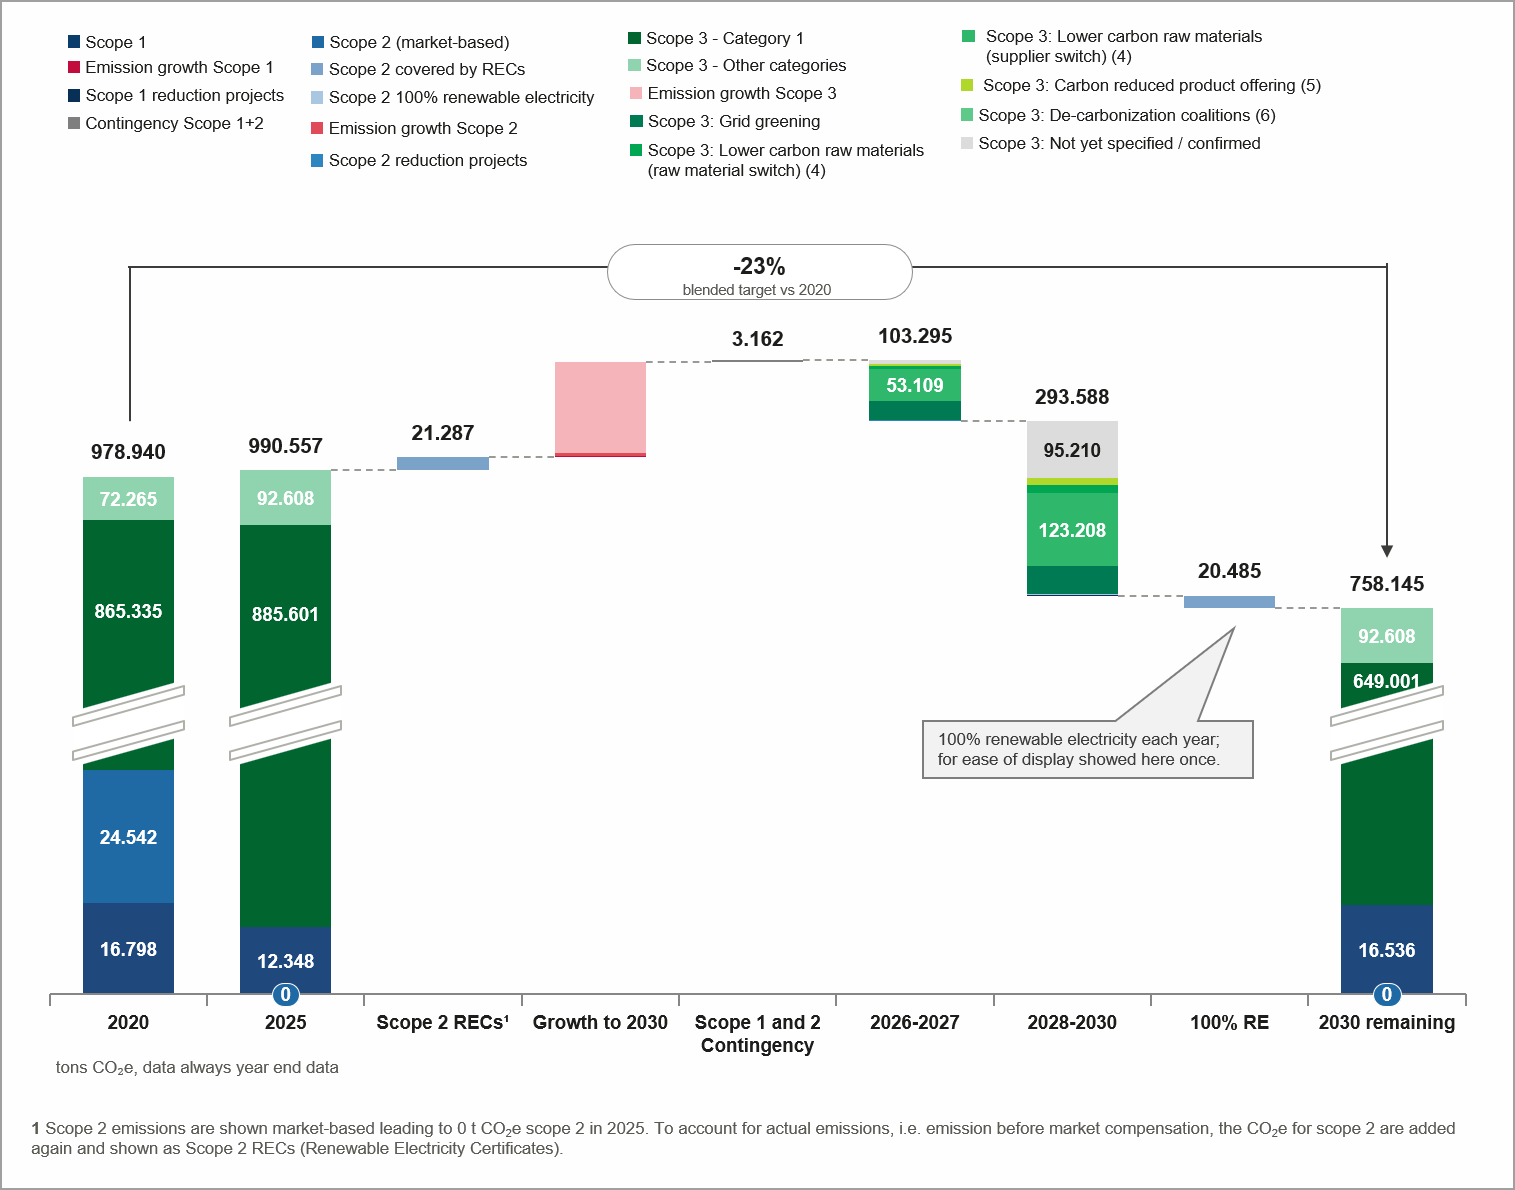
Figure 14: Aggregated Scope 1-3 emissions trajectory (2025 -2030)
5.4.2 Practical Case Studies from Reporting Year
Section titled “5.4.2 Practical Case Studies from Reporting Year”Scope 1 and 2
Section titled “Scope 1 and 2”During the reporting year, 13 projects for absolute Scope 1 and 2 emission reduction have started and/or were completed. The following highlights a few examples:
Efficiency: reduction of energy use
Section titled “Efficiency: reduction of energy use”- Replacement of old bead mills in Loeches (Spain) and Diadema (Brazil);
- replacement of cooling tower in Bhiwadi (India); and
- steam replacement in Shanghai (China), moving away from purchased steam.
Lower-carbon energy
Section titled “Lower-carbon energy”- Deliberate switch to an electricity supplier with lower emission factors in Tortuguitas (Argentina).
Installation of renewable electricity on site
Section titled “Installation of renewable electricity on site”- Solar panels in Samut Sakhon (Thailand); and
- solar panels in Toluca (Mexico).
With the installments done in 2025 Siegwerk now has solar at seven sites – with different operating models (see Figure 15). With further installations planned in the upcoming years (see Chapter 5.5.1).
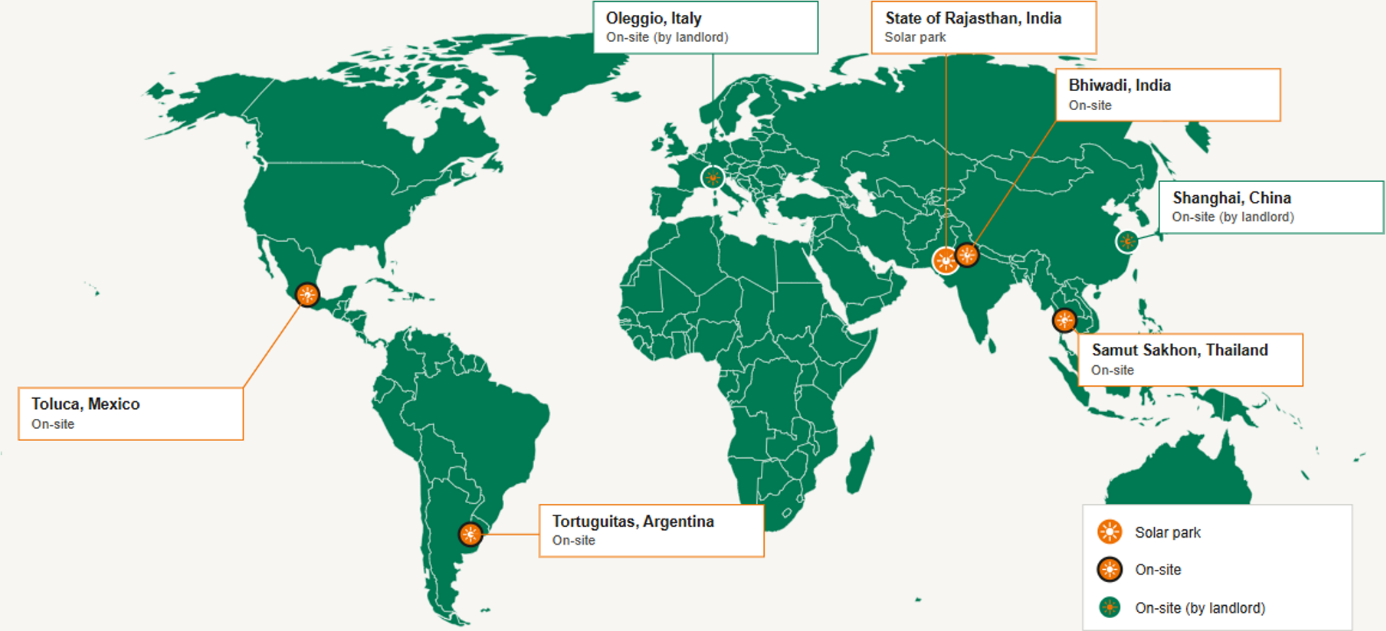
Figure 15: Siegwerk’s global solar footprint
Scope 3
Section titled “Scope 3”For the reporting period there were no concrete case studies for the reduction of Category 1 (Purchased Goods and Services) of Scope 3 emissions, which would contribute to a reduction. Rather, as mentioned, the focus was on building a data foundation.
This data foundation was, however, used to provide more than 40 customers with the partial product carbon footprint (P-PCF) for the specific products purchased from Siegwerk. This is the basis for future decisions on lower carbon products and as such lower carbon raw materials for Siegwerk. It also supports the development of a solid data foundation for customers’ Scope 3 emissions, contributing to a value-chain ambition of data-driven Scope 3 climate action.
5.5 Progress & Outlook
Section titled “5.5 Progress & Outlook”Chapter 5.4 sets out the actions through which Siegwerk implements its climate transition plan. This section reports the results of those actions against the HorizonNOW 2025 targets that close with the reporting year, explains the underlying emission trend, and outlines the outlook under HorizonNOW 2030.
5.5.1 Scope 1 and 2
Section titled “5.5.1 Scope 1 and 2”Progress against 2025 targets
Section titled “Progress against 2025 targets”The HorizonNOW 2025 carbon neutrality target for Scope 1 and 2 consisted of three components with different achievement rates: absolute reduction including production of own renewable electricity, purchasing renewable electricity certificates (REC) and investment in carbon offsets. Overall, Siegwerk did not achieve the 2025 carbon neutrality target – despite some significant advancements.
The results can be explained as follows:
Absolute reduction
Section titled “Absolute reduction”The absolute reduction component included a 60% absolute reduction in Scope 1 and 2 GHG emissions versus the 2020 baseline, excluding renewable electricity certificates and carbon offsets. This component was not achieved. Gross Scope 1 and 2 emissions before the application of market instruments declined from 41,340 tons CO₂e in 2020 to 32,948 tons CO₂e in 2025, equating to an absolute reduction of approximately 20%. Implementation timelines were slower than planned. In particular, the ramp-up of site-level carbon reduction pathways took significantly longer than anticipated. In addition, volume and emission-factor effects influenced the absolute trajectory.
Renewable electricity certificates
Section titled “Renewable electricity certificates”In order to achieve carbon neutrality all remaining emissions from electricity need to be covered. This target component was achieved fully through the purchase of RECs aligned with RE100-type quality criteria. Full coverage was first achieved in 2023 – ahead of the 2025 target year – and has been maintained since. This reduces the emissions from electricity to zero. It allowed us to achieve our science-based near-term targets validated by the Science Based Targets initiative (SBTi) – a 42% absolute reduction in Scope 1 and 2 emissions by 2030 and 100% renewable electricity – under the SBTi methodology which recognizes renewable electricity certificates as a market-based instrument for Scope 2 reduction.
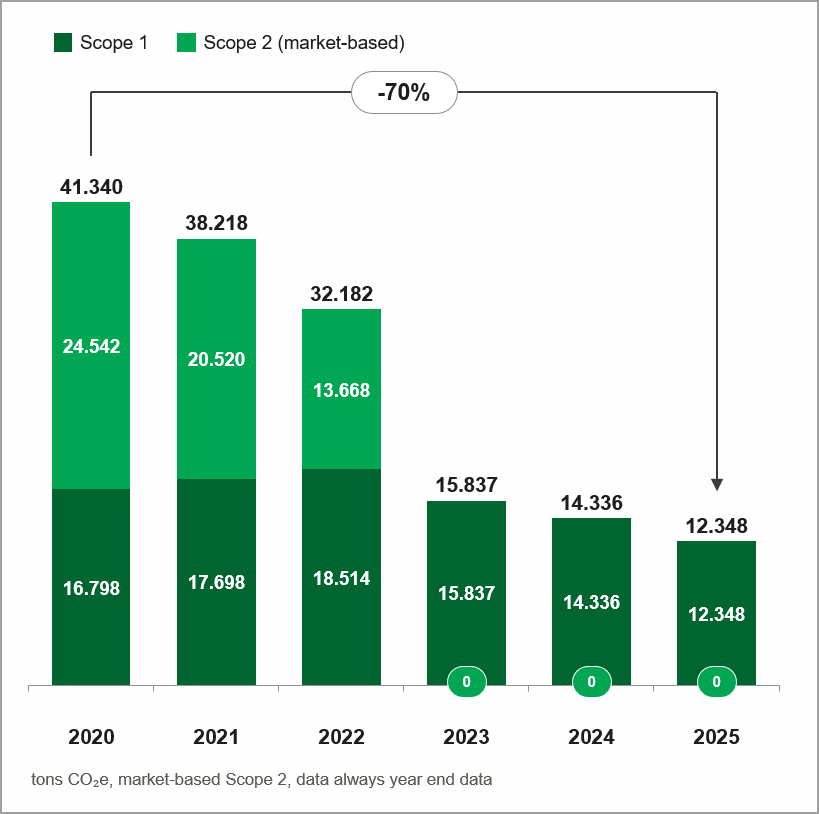
Figure 16: Scope 1 and 2 development 2020-2025
Carbon offsets
Section titled “Carbon offsets”No offsets were procured for the residual Scope 1 emission. This was a conscious decision taken in 2024, reflecting increasing scrutiny of the offset market and a broader move away from carbon neutrality claims based on compensation. That approach is also reflected in the updated HorizonNOW 2030 targets, which focus on absolute reduction and renewable electricity quality rather than offsetting. Stepping back from Scope 1 offsetting also limited the rationale for investing in long-term high-integrity offset projects versus one-time purchases of traded credits.
Outlook
Section titled “Outlook”Looking ahead under HorizonNOW 2030, Scope 1 and 2 actions continue along the two pillars described in chapter 5.4: absolute reduction and high-quality renewable electricity; including:
Investments in energy efficiency and lower-carbon energies: Siegwerk will drive implementation of identified projects, including replacement of older equipment (for example grinding assets) and electrification of heating infrastructure (e.g. concrete projects planned in France). While the list of reduction projects is strong, additional focus will also lie on conducting energy studies to develop or update structured carbon reduction roadmaps.
Investments in on-site solar. At the time of writing, construction or permitting is under way for Morganton (USA) and for further solar in India. Further installations are planned, including in Indonesia and Turkey. Some of these investments are supported by the Green Fund.
Renewable electricity sourcing: To increase the quality and additionality of renewable electricity beyond unbundled certificates and to address some of the physical limitations of on-site solar, Siegwerk is developing concrete business cases for power purchase agreements (including cohort PPAs) and related instruments. The aim is to progressively reduce reliance on unbundled energy attribute certificates while maintaining 100% renewable electricity coverage.
Taken together, these measures underpin the HorizonNOW 2030 Group target of a 60% absolute reduction in Scope 1 and 2 emissions by 2030 versus 2020, while maintaining 100% renewable electricity and improving the additionality of sourced renewables.
A key challenge for absolute reductions is the strong growth plans and related investments in capacity expansion in countries such as Turkey, Indonesia and India. Typically, these countries have relatively higher emission factors. Furthermore, we are seeing an increase in emission factors in the USA due to the increased electricity demand from data centers.
5.5.2 Scope 3
Section titled “5.5.2 Scope 3”Progress against 2025 targets
Section titled “Progress against 2025 targets”No annual Scope 3 target was set for 2025. We steer against the overall reduction trajectory rather than against a single-year waypoint.
In absolute terms, compared to our baseline year, Scope 3 emissions increased with a jump visible especially from 2024 to 2025. For Scope 3 categories other than Category 1, Purchased Goods and Services, this is mainly due to new options of more granular data collection and especially analysis within reasonable effort – the latter especially due to the recent development in AI. The rise in Category 1, Purchased Goods and Services, reflects an increased production volume and therefore higher raw-material demand. Relative to production volume, emissions in Category 1 remain on a downward trajectory compared with 2020.
Year-on-year changes versus 2024 also reflect a shift in our product portfolio and, in several cases, a deliberate product strategy: the move from nitrocellulose-based to polyurethane-based ink systems, and stronger sales of mixed varnishes, often driven by our push to enable circular packaging. These movements show that trade-offs are real and need to be made transparent as we develop our product sustainability assessment (see Chapter 8.3). They also underline why supplier-specific data matters. Without it, we cannot navigate progress proactively and remain subject to secondary effects from database updates or from the mix of products we sell.
In 2026, in line with the recommendation from the third-party verification, we will update the ecoinvent database currently used. This update is likely to increase reported emissions and will require an adaptation of the baseline.
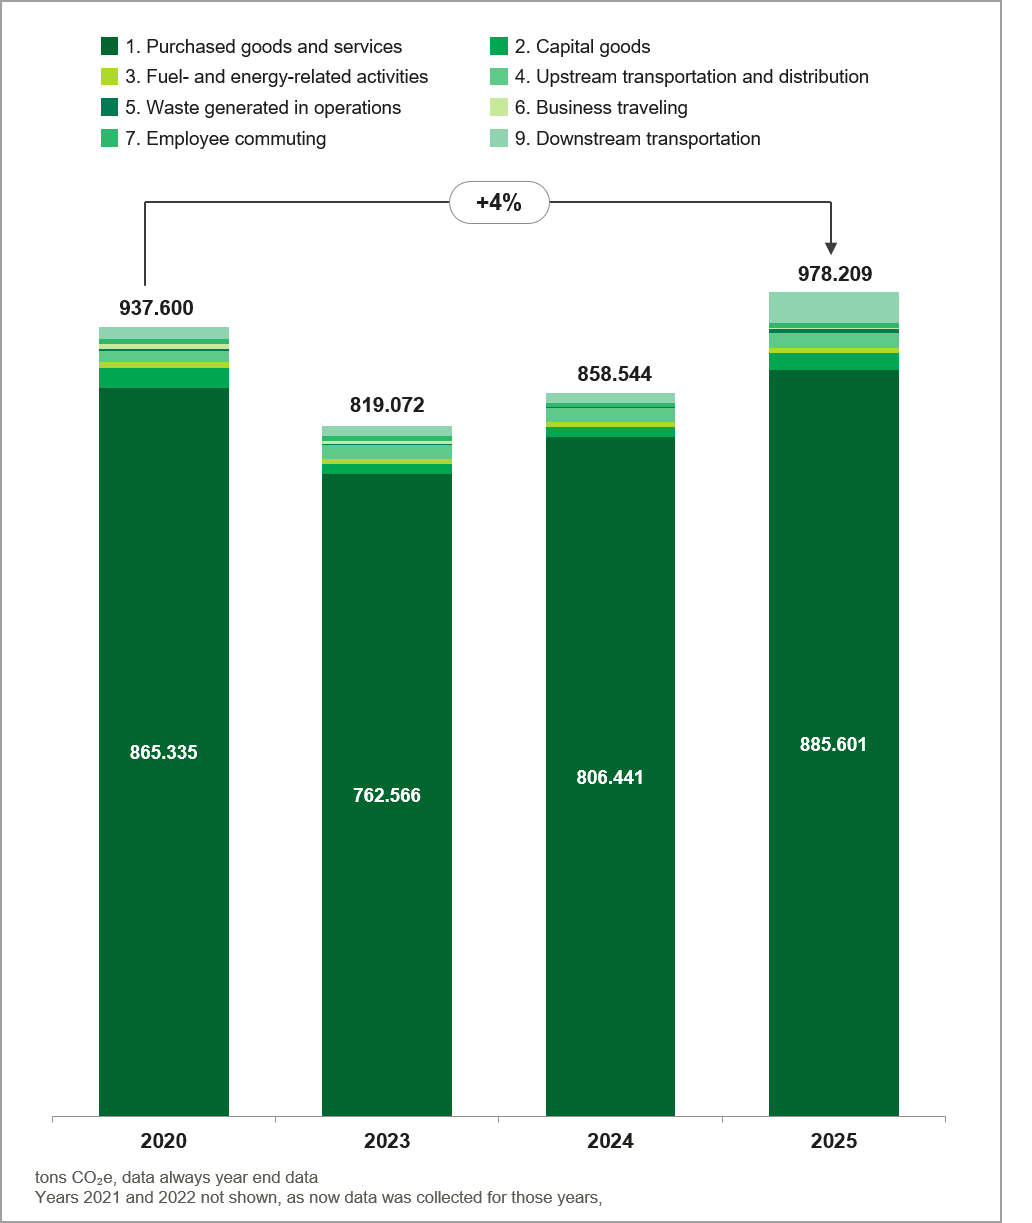
Figure 17: Scope 3 emission development 2020 - 2025
Outlook
Section titled “Outlook”Upstream
Section titled “Upstream”Supplier-specific data remains a challenge. While this report was being prepared, another data request was launched for suppliers covering roughly 50% of raw material spend. The response indicated limited willingness or ability to share data at the level required for Siegwerk’s ISO 14067:2019 compliance. Siegwerk will continue to request primary supplier data as the basis for carbon-informed supplier switching.
Some suppliers are actively developing lower-carbon raw materials at commercially competitive prices, often by increasing biogenic carbon content. In some cases, this can reduce fossil-based greenhouse gas (GHG) emissions reflected in Siegwerk’s Scope 3 Category 1 accounting. In others, the benefit may arise only at end-of-life, where biogenic content can be deducted in accordance with ISO standards.
Downstream
Section titled “Downstream”While currently downstream climate action has not been identified as a material topic, this can change in future as more downstream value chain partners expand their focus from circular product solutions (see Chapter 6.4.1) to product solutions that address mitigating the impact of packaging on climate change. Inks and coatings, despite their overall very small contribution to the climate footprint of packaging, can facilitate reducing the impact of packaging on climate change. Current options in terms of transparency of the climate impact of our products and emerging product solutions can be found in Chapter 8.
5.6 Climate Risk Assessment
Section titled “5.6 Climate Risk Assessment”This sub-chapter discloses how Siegwerk identifies and assesses climate-related risks and opportunities, the scenario analysis applied, and the implications for climate resilience. It responds primarily to ESRS E1-2 (identification of climate-related risks and scenario analysis) and ESRS E1-3 (resilience in relation to climate change).
5.6.1 Scope and Governance
Section titled “5.6.1 Scope and Governance”The climate risk assessment covers manufacturing sites, warehouses, laboratories and offices in the reporting boundary defined for the double materiality assessment (DMA), including upstream exposures (key raw-material, energy and transport suppliers) and selected downstream transition exposures linked to customer and regulatory expectations. Small offices with low operational significance, certain suppliers with insufficient influence or immaterial contribution, and recently acquired sites without usable data at the assessment date were excluded, with reasons documented in the assessment register.
Time horizons applied are short term (0–1 year), medium term (1–5 years) and long term (more than 5 years), consistent with ESRS 1 time intervals applied to the DMA and with Siegwerk’s planning cycles for operations, strategy and capital expenditure. Global Sustainability owns the assessment, with contributions from HSE, Operations, Procurement, Finance, Supply Chain and Site Management. Version 1.1 of the Climate Risk Assessment Register is the source of the findings reported below.
5.6.2 Methodology
Section titled “5.6.2 Methodology”Risk identification combined three evidence streams:
- site-based environmental and climate assessments consolidated across seven countries (Thailand, Mexico, Argentina, Germany, Indonesia, India and France);
- climate-related impacts, risks and opportunities from the double materiality assessment (DMA); and
- prior climate risk work used for CDP and related disclosures.
Limitations of this approach include different local formats and languages, which have been addressed by translations and alignment with the document owners to ensure correct interpretation.
Physical hazards screened include sea-level rise and coastal flooding, mean temperature rise, heatwaves, bushfires, extreme rainfall and flooding, extreme storms, and drought. Transition drivers include carbon pricing and related regulation, energy-cost and grid instability, and changing customer and regulatory expectations for circular and low-carbon packaging.
Risk assessment follows several parameters:
- likelihood: ranges from “Rare” to “Almost Certain”;
- consequence: scored on a five-point scale ranges from “Insignificant” to “Catastrophic”;
- existing controls are rated as “Substantially effective”, “Partially effective” or “Largely ineffective”;
- positive climate impacts and commercial opportunities are evaluated separately on an attractiveness scale (Emerging / Moderate / Strong / Transformational) so that opportunities are not netted against downside risks; and
- financial-effect illustrations for heatwaves, flooding, water scarcity, carbon taxation and customer recycling requirements are high-level estimates for stress-testing and management discussion; they are not financial forecasts and remain subject to finance validation.
5.6.3 Scenario Analysis
Section titled “5.6.3 Scenario Analysis”Climate-related scenario analysis compares two pathways:
- Net Zero 2050 (approximately 1.5°C): orderly mitigation with stronger policy and market transition pressure, used in particular to stress transition risks and opportunities; and
- current Policies (greater than 3°C): higher physical hazard intensity under limited additional mitigation, used to stress physical risks to sites and supply chains.
This approach meets the ESRS E1-2 expectation to use at least one high-emission physical pathway and at least one 1.5°C-aligned transition pathway:
The assessment date for the consolidated register is mid-2025 to August 2026 for updates. Key assumptions include continued regulatory tightening under the 1.5°C pathway, higher acute and chronic physical hazard intensity under Current Policies (>3°C), and that ink and coating raw materials remain outside current CBAM product lists while carbon pricing and energy-cost pressure still affect operating costs indirectly. Key assumptions under Current Policies (>3°C) include limited additional mitigation beyond policies already in force, materially higher acute and chronic physical hazard intensity at our sites and in upstream supply chains.
Scenario analysis is used for stress-testing resilience, not for forecasting.
Results
Section titled “Results”Under the Net Zero 2050 (1.5°C) pathway, the register shows two “Extreme”, six “High”, seven “Medium” and four “Low” downside risks. Under Current Policies (>3°C), “Extreme” risks rise to six and “High” risks remain at six, bringing “High” or “Extreme risks” to 12 from 8 under 1.5°C. Ten risks worsen under the higher-warming pathway; none improve. In parallel, “Strong” opportunities increase from one under 1.5°C to six under >3°C, reflecting greater relative value of renewable electricity, on-site generation, low-emission products and energy independence when physical disruption and transition differentiation intensify.
Number of downside risks | Net Zero 2050 (1.5°C) | Current Policies (>3°C) |
|---|---|---|
Extreme | 2 | 6 |
High | 6 | 6 |
Medium | 7 | 5 |
Low | 4 | 2 |
Table 12: Downside climate risks
Number of opportunities | Net Zero 2050 (1.5°C) | Current Policies (>3°C) |
|---|---|---|
Transformational | 0 | 0 |
Strong | 1 | 6 |
Moderate | 7 | 3 |
Emerging | 1 | 0 |
Table 13: Upside climate opportunities
Material physical risks
Section titled “Material physical risks”Physical risk concentrates on heat stress, flooding and extreme rainfall, drought and low water, storms, and upstream raw-material availability. Workplace heat stress is “Almost certain” under 1.5°C (Medium residual rating with a developing global internal standard rated substantially effective) and rises to “High” under >3°C as consequence increases. Flooding and extreme rainfall are “Unlikely/Medium” under 1.5°C and “Likely/High” under >3°C, with site evidence from Indonesia (drainage capacity for a 25-year runoff event) and Germany (heavy-rain and flood exposure). Drought and storm-related building and equipment risks are “Low” under 1.5°C and rise to “Medium” under >3°C; dedicated adaptation controls are largely not yet documented beyond general energy-management measures.
Upstream, climate-driven temperature rise, extreme weather and water stress may reduce availability of agricultural, forestry and other renewable raw materials (approximately 30% of Siegwerk’s raw materials) raising input prices and disruption risk. This exposure is “High” under 1.5°C and “Extreme” under >3°C. Controls rely on a broad supplier base, formulation flexibility, alternative qualification and climate screening of key supplier locations, currently rated partially effective.
Material transition risks
Section titled “Material transition risks”The leading transition risk is market and regulatory demand for circular, low-carbon and water-efficient packaging. Loss of share for high-carbon or less-circular products is rated “High” under 1.5°C and “Extreme” under >3°C. Source analysis indicates a potential revenue impact relating to all products that have been developed specifically to support the transition towards circular and low carbon packaging, reflected in the CE share in our portfolio as shown in Chapter 6.4.1. Carbon pricing, ETS exposure and related cost pressure move from “Medium (Unlikely)” under 1.5°C to “High (Likely)” under >3°C. Direct CBAM product coverage for ink and coating raw materials is currently limited, so near-term selling-price effects are assessed as Low, while energy-cost and compliance pressure remain relevant for higher-emitting sites.
Operational transition-adjacent risks with climate relevance include air-emission and hazardous-materials handling exposures concentrated in India, France, Thailand and Argentina, and power-outage disruption in grids such as India and South Africa. Several of these risks worsen under >3°C as consequence or likelihood increases. They are managed primarily through HSE and site controls, with cross-links to Chapters 6 and 9.2.
Opportunities
Section titled “Opportunities”Opportunities that strengthen under higher physical and transition pressure include 100% renewable electricity, on-site solar and excess-power feed-in, mineral oil-free and water-based low-emission product lines (such as UniNATURE and UniLEAF), and reduced grid dependence through on-site generation in markets such as India, Thailand, Mexico and Argentina. These opportunities align with HorizonNOW mitigation levers already disclosed in Chapters 5.2 to 5.5 and with circular and sustainable product strategy in Chapters 7 and 8.
Anticipated financial effects (illustrative)
Section titled “Anticipated financial effects (illustrative)”Illustrative financial-effects translate selected risks into order-of-magnitude exposure using 2025 turnover as a reference base. Examples include production-day losses from heatwave-related output reduction, site shutdown assumptions for flooding at exposed locations, water-scarcity constraints on operating hours, carbon-price sensitivity on selected site Scope 1 and 2 inventories, and potential revenue effects from customer’s designed for recycling requirements. These figures are directional stress indicators for management only and will require further maturing. They are therefore not reported publicly at this time (in line ESRS 2 and ESRS E1-11 phase-in timelines).
5.6.4 Controls, Adaptation and Resilience
Section titled “5.6.4 Controls, Adaptation and Resilience”Existing controls are strongest where global standards or proven site measures are in place (for example heat-stress standard development; Argentina extraction-equipment redundancy; renewable electricity and Green Fund-supported transitions). Some physical adaptation controls for flooding, drought and storms will need to be expanded in future. Upstream residual risk remains structurally high because many climate and GHG pressures sit at tier-n extraction and agriculture, where leverage is indirect and channeled through SustainUP (Chapter 12.1).
Resilience of strategy and business model is supported by:
- SBTi-aligned Scope 1 and 2 absolute reduction and 100% renewable electricity;
- Scope 3 and Sustainable Procurement action through SustainUP;
- circular and lower-carbon product innovation addressing market transition risk; and
- progressive hardening of site adaptation measures where hazard evidence is strongest.
Significant uncertainties remain in tier-n physical data, supplier-specific climate exposure, the timing and design of carbon-pricing regimes, and the quantification of revenue-at-risk from portfolio transition. Siegwerk’s capacity to adjust rests on flexible formulations and multi-sourcing, capital allocation to carbon reducing investments and the ability to redeploy product and energy strategies over the medium and long term.
5.6.5 Outlook
Section titled “5.6.5 Outlook”Priorities for the next reporting cycle are to verify and, where needed, close site-level adaptation gaps (drainage, heat, water and storm preparedness), validate financial-effect assumptions with Finance for ESRS E1-11 readiness, deepen climate screening of high-revenue and high-hazard suppliers, and keep the risk register synchronized with DMA updates and HorizonNOW transition-plan progress. The assessment will be refreshed when material changes in assets, geographies, regulation or climate evidence occur.
5.7 Climate Change as Direct Driver of Biodiversity Loss (ESRS E4)
Section titled “5.7 Climate Change as Direct Driver of Biodiversity Loss (ESRS E4)”Climate change is a direct driver of biodiversity loss under ESRS E4. Siegwerk identified material negative impacts on climate change (ESRS E1) - and thereby on biodiversity and ecosystems - linked to greenhouse gas (GHG) emissions. This sub-topic is therefore covered in the Climate Change chapter and managed through the policies, targets and actions in Chapters 5.2 to 5.5 . Working under the assumption that limiting the impact on climate change, Siegwerk will limit secondary losses of biodiversity.
For materiality in the downstream value chain of this sub-topic the potential impact on human rights was the decisive factor for materiality through the human rights override designed into our DMA.
Our response follows the overall climate transition. Climate is embedded in the Sustainability Policy and Business Partner Code of Conduct. Scope 1 and 2 actions under HorizonNOW combine absolute energy and emission reduction with 100% renewable electricity, anchored by SBTi-validated targets and the HorizonNOW 2030 pathway toward a 60% absolute Scope 1 and 2 reduction by 2030 versus 2020 (Chapters 5.3 to 5.5).
Because upstream materiality rests on the human rights override, supplier action is channeled through SustainUP (Chapter 12.1), Siegwerk’s supplier sustainability program. SustainUP has a strong human rights focus alongside climate expectations: risk-based screening, dialogue, capability building and escalation where needed. Carbon reduction in raw materials and responsible supply-chain conduct are thus pursued in one program.
Footnotes
Section titled “Footnotes”No Scope 3 data for the year 2021 and 2022 collected. Therefore, no data is displayed in the table for Scope 3. Approach is confirmed by third party verification. Scope 3 categories “10. Processing of sold products” and “11. Use of sold goods” have been calculated but are not included due to high levels of uncertainty. ↑
Data category REC (Renewable Electricity Certificates) includes all certificates purchased (bundled and unbundled) and excludes any renewable electricity generated through solar on-site or in an off-site PPA. ↑